Hearing is important for many animals to perceive their acoustic environment. It helps them to communicate with conspecifics, to find partners, to catch prey or avoid predators. Each species has a specific frequency range in which it hears best.
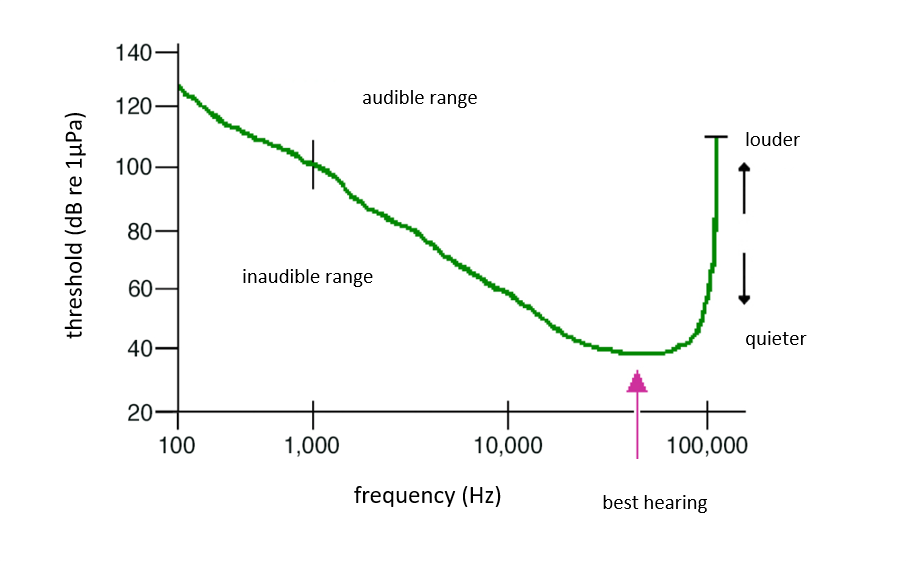
An individual's hearing range is defined by the sound level required to perceive the respective frequency and is limited by a lower limit, called 'hearing threshold', under which sounds are not audible. Individual hearing ranges can then be represented in a graph showing this hearing threshold for several frequencies. The area above this threshold corresponds to the audible range of an animal and the lowest intensity corresponds to the frequency it hears best. This representation, called an audiogram or hearing curve, illustrates the individual hearing range at various frequencies, and may be extrapolated to the species to which individuals belong.
Audiograms can be generated by two main methodologies:
Behavioural psychophysical methods: in this methodology, animals are trained to indicate when they have heard a sound with given acoustic properties (for instance by pressing a button). If the animals show the correct response, this behaviour is positively reinforced, for example by receiving a reward ("operant conditioning"). The animals can then be exposed to different frequencies of varying loudness. By increasing or decreasing the intensity, detection thresholds can be measured for different frequencies.
Auditory brainstem response (ABR): these methods don't require the training of animals, but the measurement of their brain activity (auditory evoked potentials - AEP) in response to auditory stimuli. Towards this end, electrodes placed on the skin record very small voltage differences that are elicited when playing sounds of different frequency and intensity. AEP measurements do not give true representations of hearing ranges. For many species (especially for fishes) AEP experiments do not represent accurately the hearing bandwidth or sensitivity.
The relative sound level of the just audible signal in decibels (dB) is plotted on the y-axis in relation to a reference pressure of 20 µPa (in air) or 1 µPa (in water). The sound intensity increase from bottom to top. Therefore, an animal is more sensitive to sound when the curve is lower.